A relation is a relationship between sets of values. Relations in mathematics are usually represented as ordered pairs: (input, output) or \((x, y)\text{.}\) When observing relations, we often refer to the \(x\)-values as the domain and the \(y\)-values as the range.
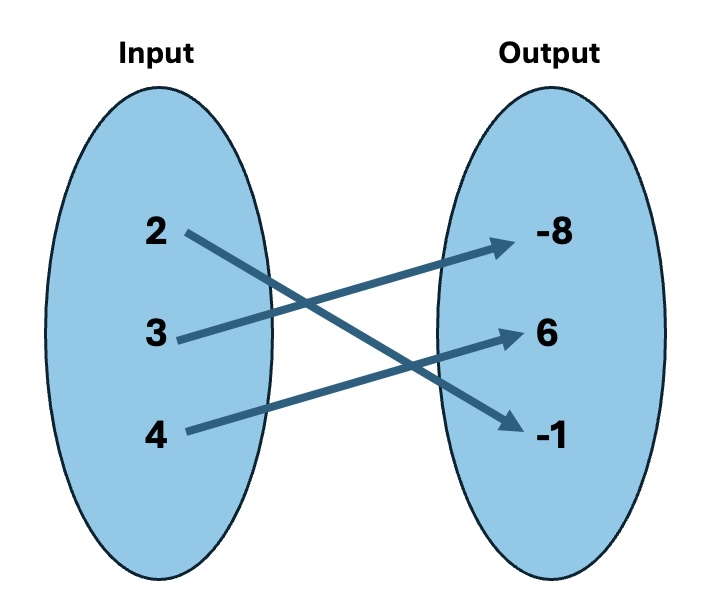
Mapping Notation (also known as an arrow diagram) is a way to show relationships visually between sets. For example, suppose you are given the following ordered pairs: \((3, -8), (4,6)\text{,}\) and \((2,-1)\text{.}\) Each of the \(x\)-values "map onto" a \(y\)-value and can be visualized in the following way:
Figure2.1.3.Every \(x\)-value from the ordered pair list is listed in the input set and every \(y\)-value is listed in the output set. An arrow is drawn from every \(x\)-value to its corresponding \(y\)-value.
Consider the menus shown below for two different fast food restaurants. We’ll consider the Items as inputs (\(x\)-values) and the Cost as outputs (\(y\)-values).
We see that in Activity 2.1.9, the McRonald’s menu is a function. There is no confusion in determining the cost of a given menu item. However, Burger Queen’s menu is not a function. There is a discrepancy in the cost of nuggets, and the menu could cause confusion.
Let’s revisit some of the sets of ordered pairs we’ve previously explored in Activity 2.1.4, Activity 2.1.5, and Activity 2.1.6. Which of the following sets of ordered pairs represent a function?
Relations can also be expressed in words. Suppose you are looking at the amount of time you spend studying versus the grade you earn in your Algebra class. Is this an example of a function? Why or why not?
Notice that when trying to determine if a relation is a function, we often have to rely on looking at the domain and range values. Thus, it is important to be able to idenfity the domain and range of any relation!
You probably noticed (in Activity 2.1.15) that when the graph has points that "line up" or are on top of each other, they have the same \(x\)-values. When this occurs, this shows that the same \(x\)-value has two different outputs (\(y\)-values) and that the relation is not a function.
Start by drawing a vertical line anywhere on the graph and observe the number of times the relation on the graph intersects with the vertical line. If every possible vertical line intersects the graph at only one point, then the relation is a function. If, however, the graph of the relation intersects a vertical line more than once (anywhere on the graph), then the relation is not a function.
If \(x=4\text{,}\)\(y\) could be \(-3\) or \(3\text{.}\) Given that there are two outputs for a given \(x\text{,}\) then \(x^2+y^2=25\) is not a function.
Students may have different answers. Ideally, you want students to see that they can check whether a given relation is a function in more than one way. They can test values (as this activity did by leading them to plug in values) or by using the vertical line test on a graph.
Notice that Activity 2.1.19 shows that equations with a \(y^2\) term generally do not define functions. This is because to solve for a squared variable, you must consider both positive and negative inputs. For example, both \(2^2=4\) and \((-2)^2=4\text{.}\)
It’s important to be able to determine the domain of any equation, especially when thinking about functions. Answer the following questions given the equation \(y=\sqrt{x-2}\text{.}\)
There are many more \(x\)- values than just those found above that, when plugged in, give a defined value for \(y\text{.}\) How can we represent the domain of this equation in interval notation?
When determining the domain of an equation, it is often easier to first find values of \(x\) that make the function undefined. Once you have those values, then you know that \(x\) can be any value but those.